

Mehra MAC
Reducing industrial electricity costs with 100 kWp solar.
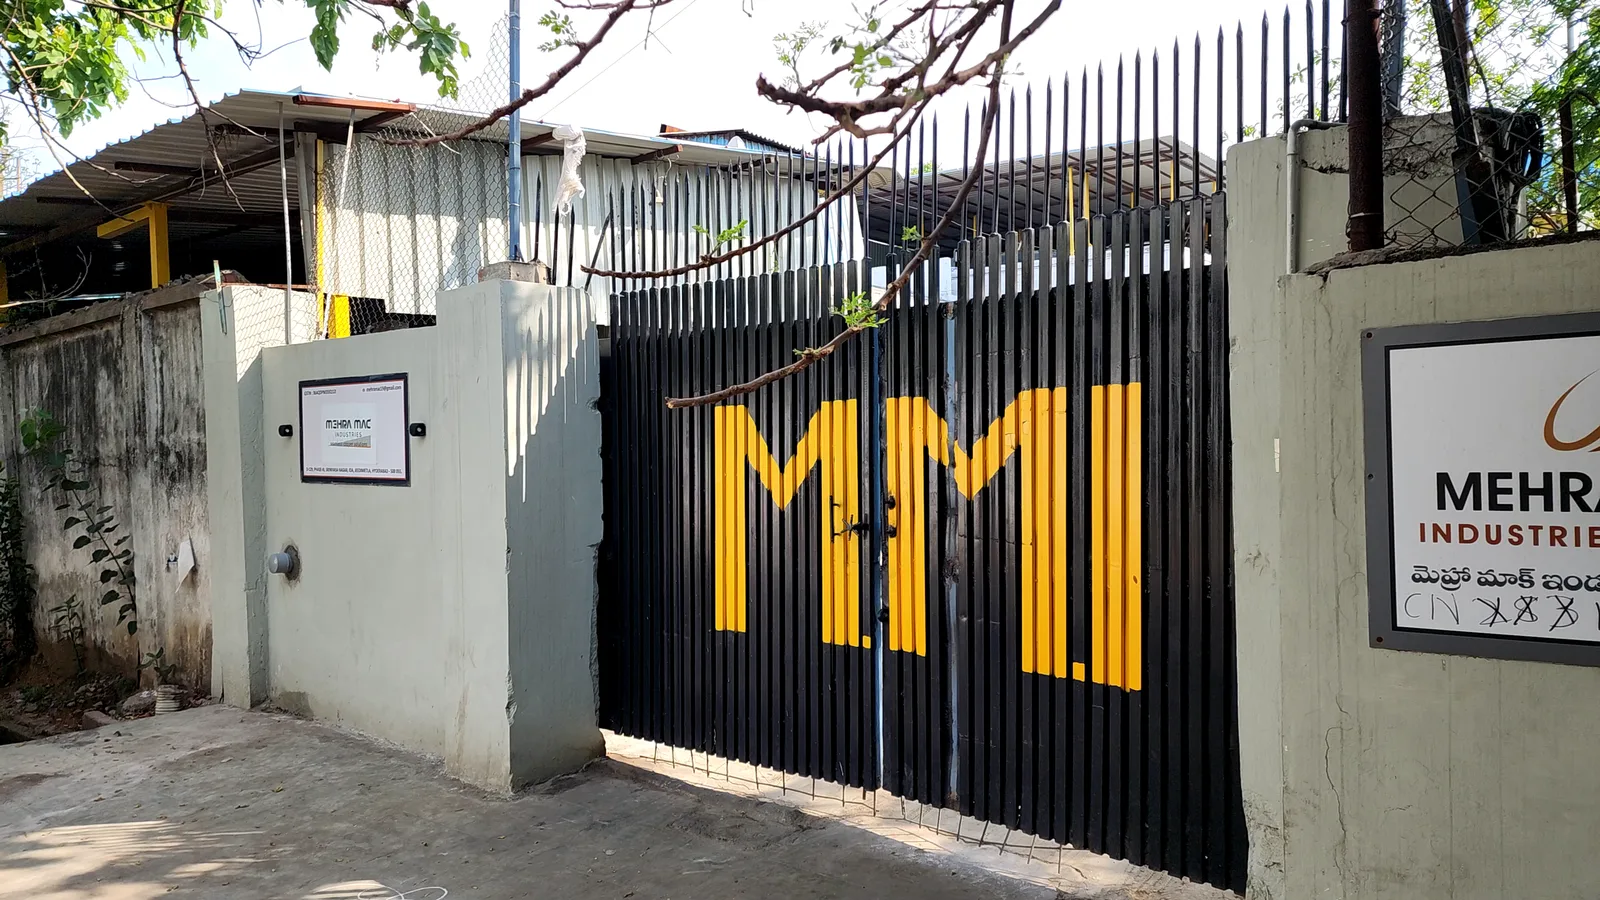
A copper-manufacturing HT industrial consumer in IDA Jeedimetla.
Mehra MAC is a copper manufacturing business located in IDA Jeedimetla, Hyderabad. The facility runs on an HT industrial connection (Category 1D) with a 145 KVA contracted demand and commissioned a 100 kWp rooftop solar system through Powermore in March 2026.
A high, steady electricity load driving up monthly opex.
Before solar, the facility drew its entire load from the DISCOM at HT industrial tariffs. In July 2025 alone, Mehra MAC consumed 26,694 kWh and paid ₹2.29L in a single month, with demand and energy charges together forming the bulk of controllable operating cost.
For the impact analysis, the source report compares the pre-solar July 2025 baseline against June and July 2026, identified as the cleanest comparable post-solar cycles.
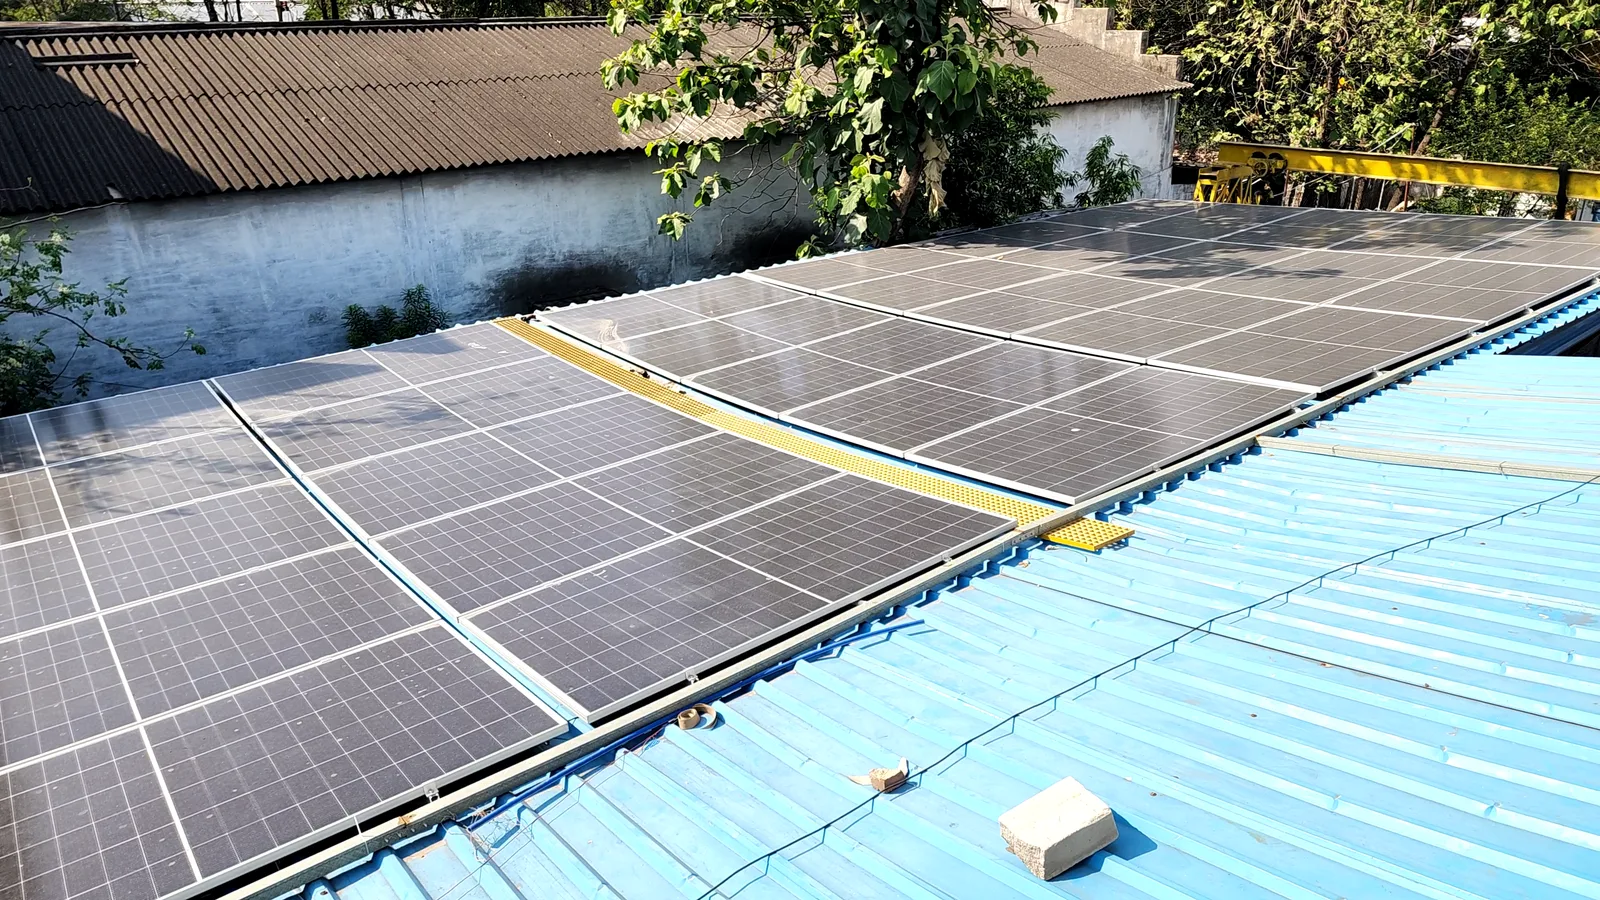
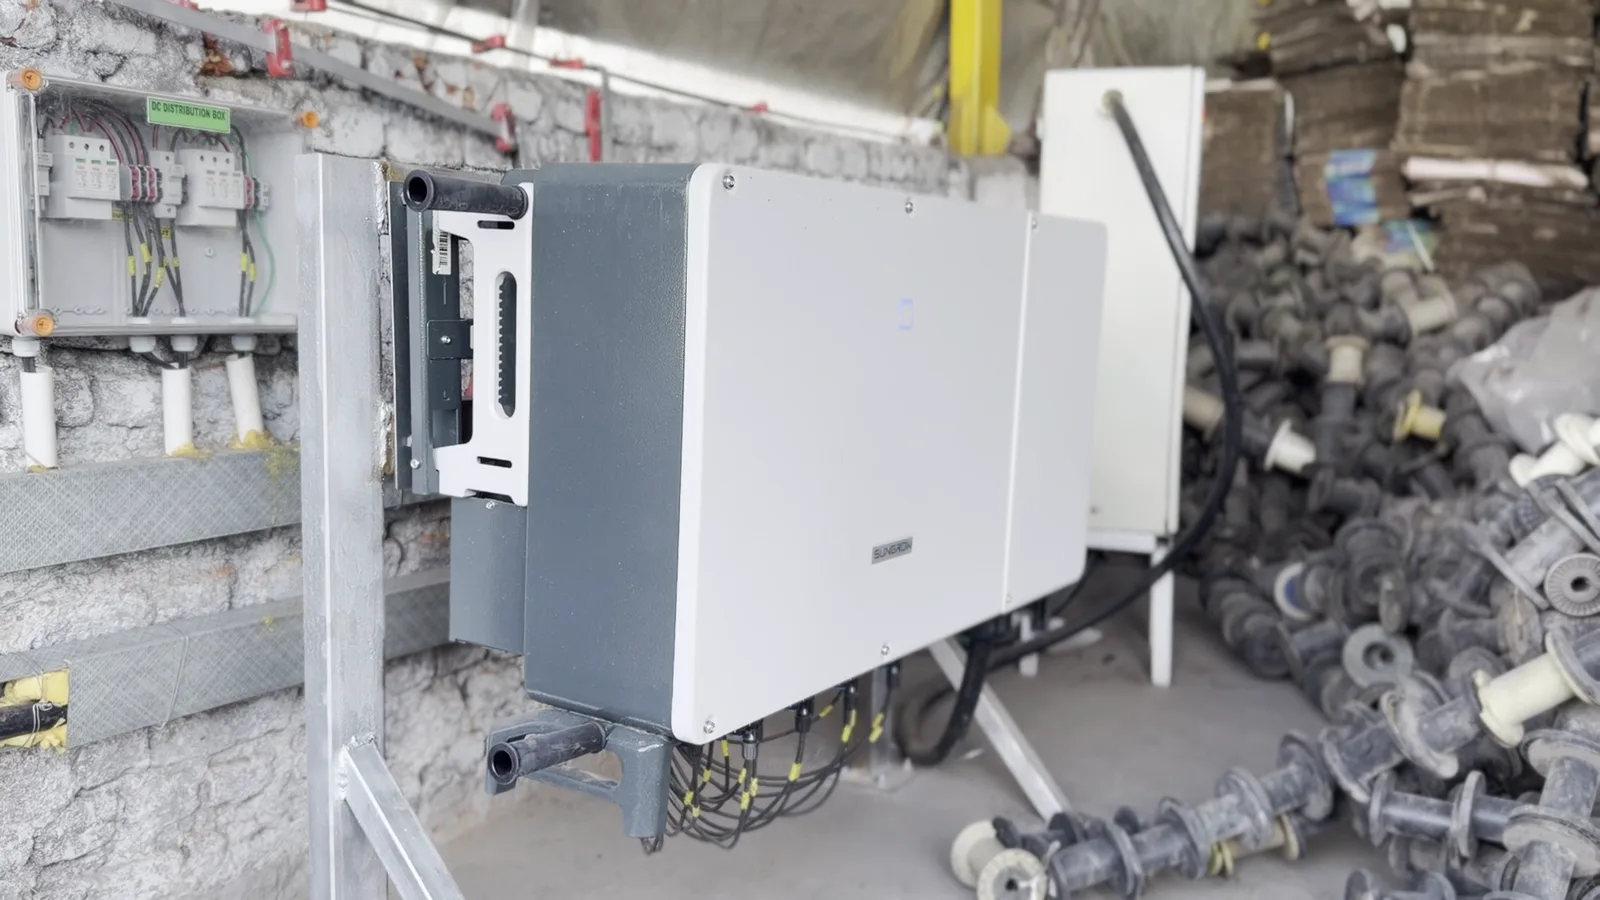
A 100 kWp rooftop solar plant, engineered and commissioned end-to-end by Powermore.
Powermore commissioned the rooftop solar system at Mehra MAC in March 2026.
Lower grid consumption. Lower electricity bills. Measurable savings.
June–July 2026 were used as the cleanest comparable post-solar cycles in the source report.
Electricity bill values from the case study. April 2026 is not used in the savings baseline because it included a one-time ₹24,038 ICD settlement credit unrelated to solar performance.
The economics of the installation.
What the numbers actually show.
- 01Grid consumption fell 48%, consistent with the expected offset from a 100 kWp system for this load profile.
- 02Demand charges stayed flat post-solar. Solar offsets energy charges; contracted-demand right-sizing remains a separate lever.
- 03The April 2026 headline bill reduction was affected by a one-time ICD credit and was therefore excluded from the ROI baseline.
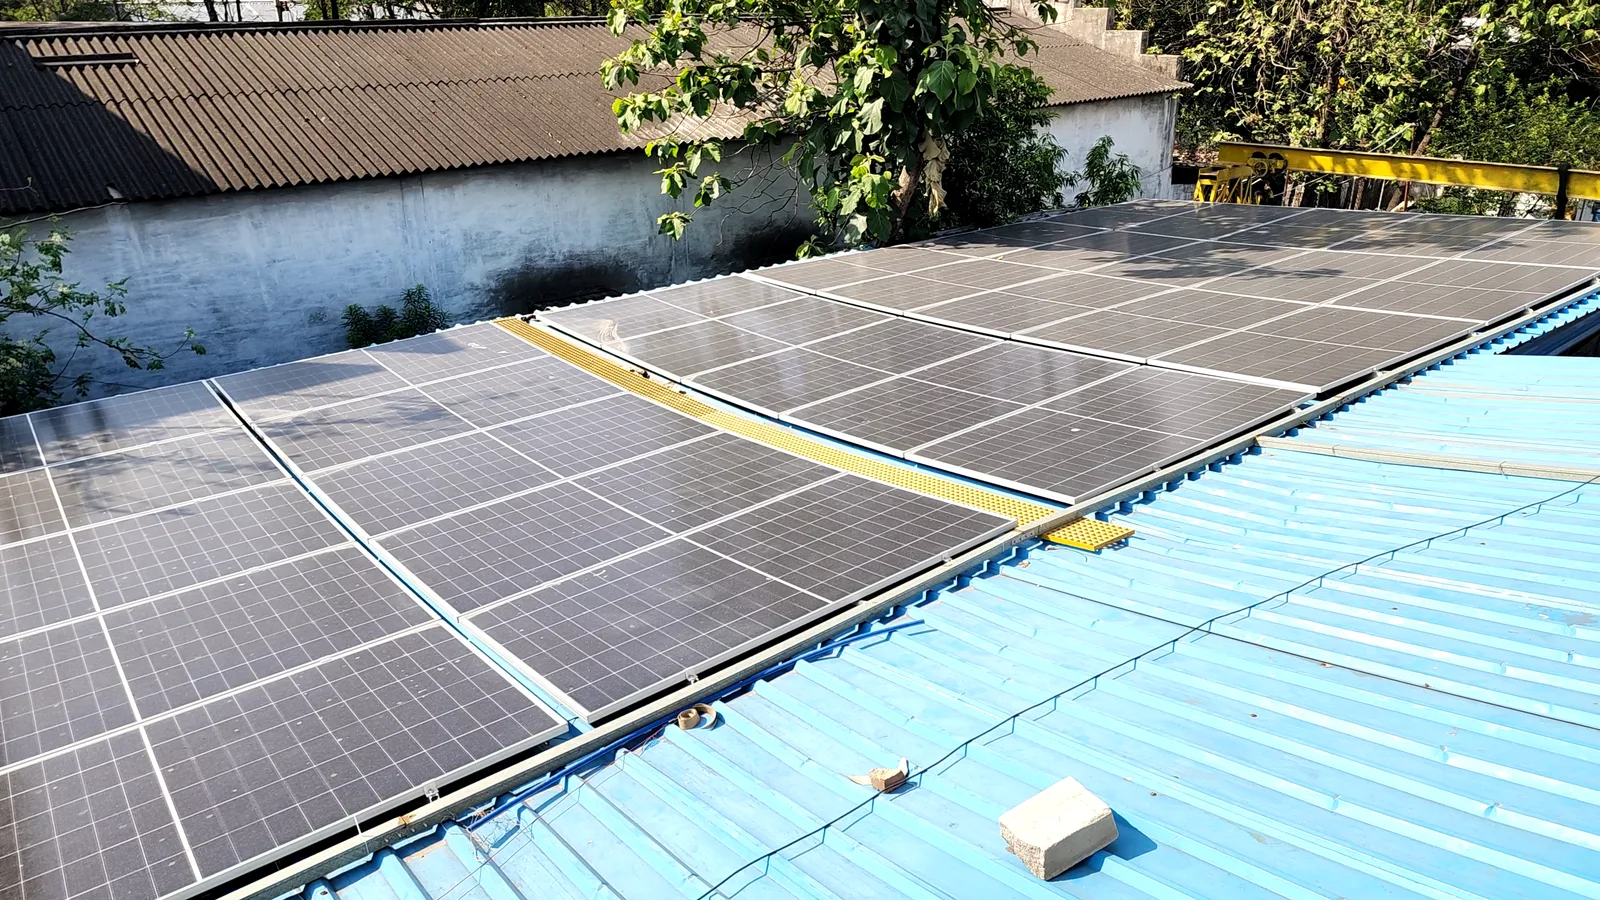
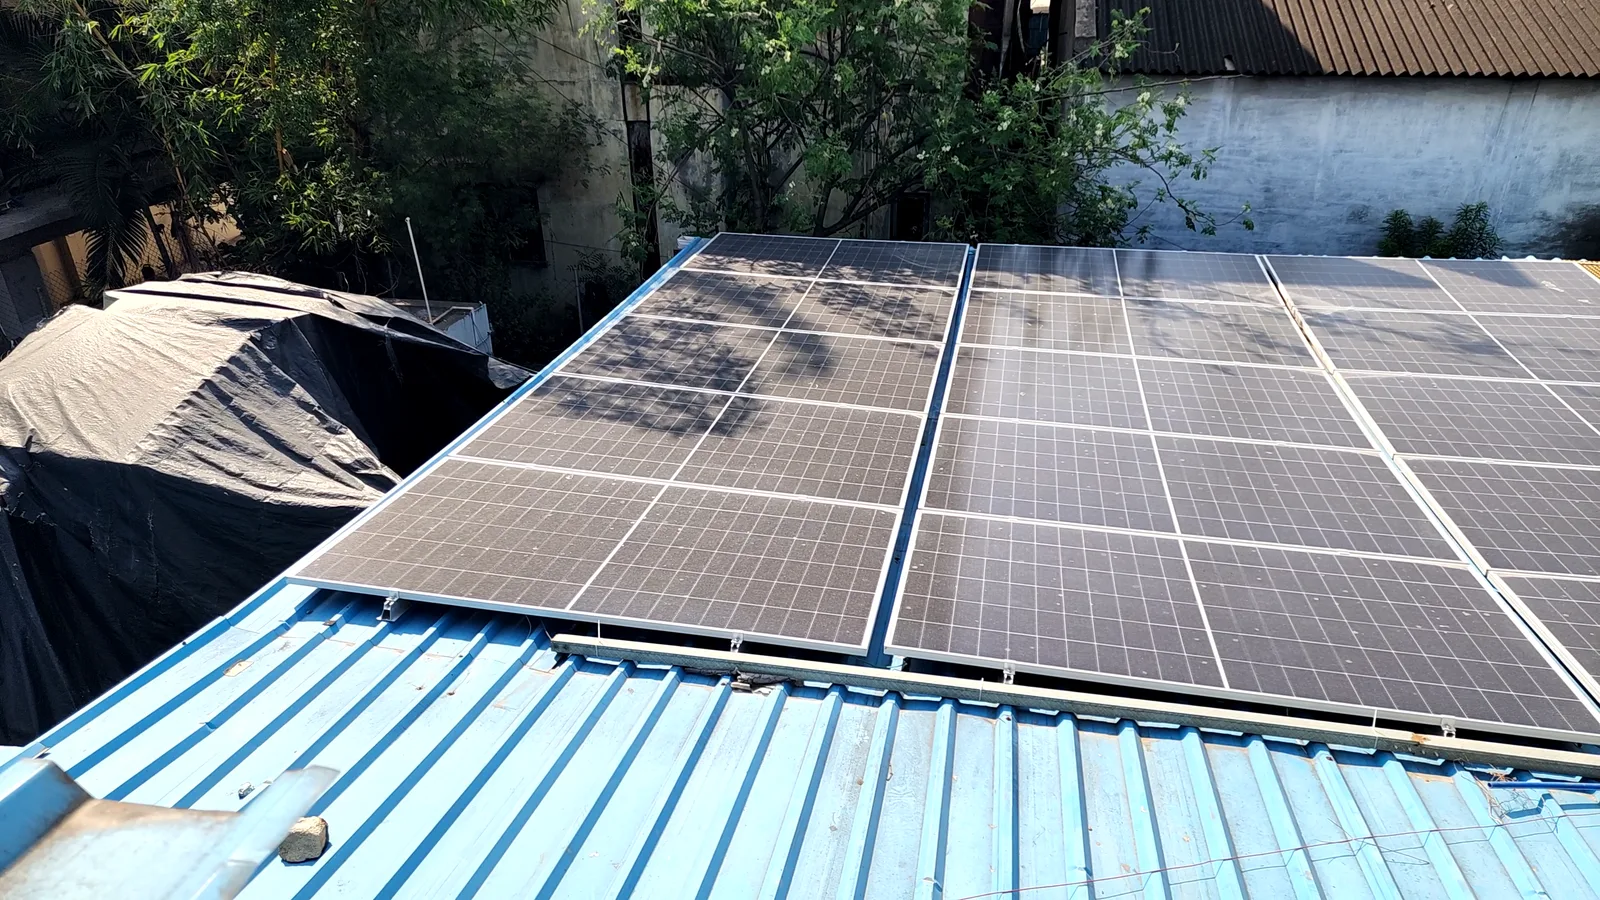
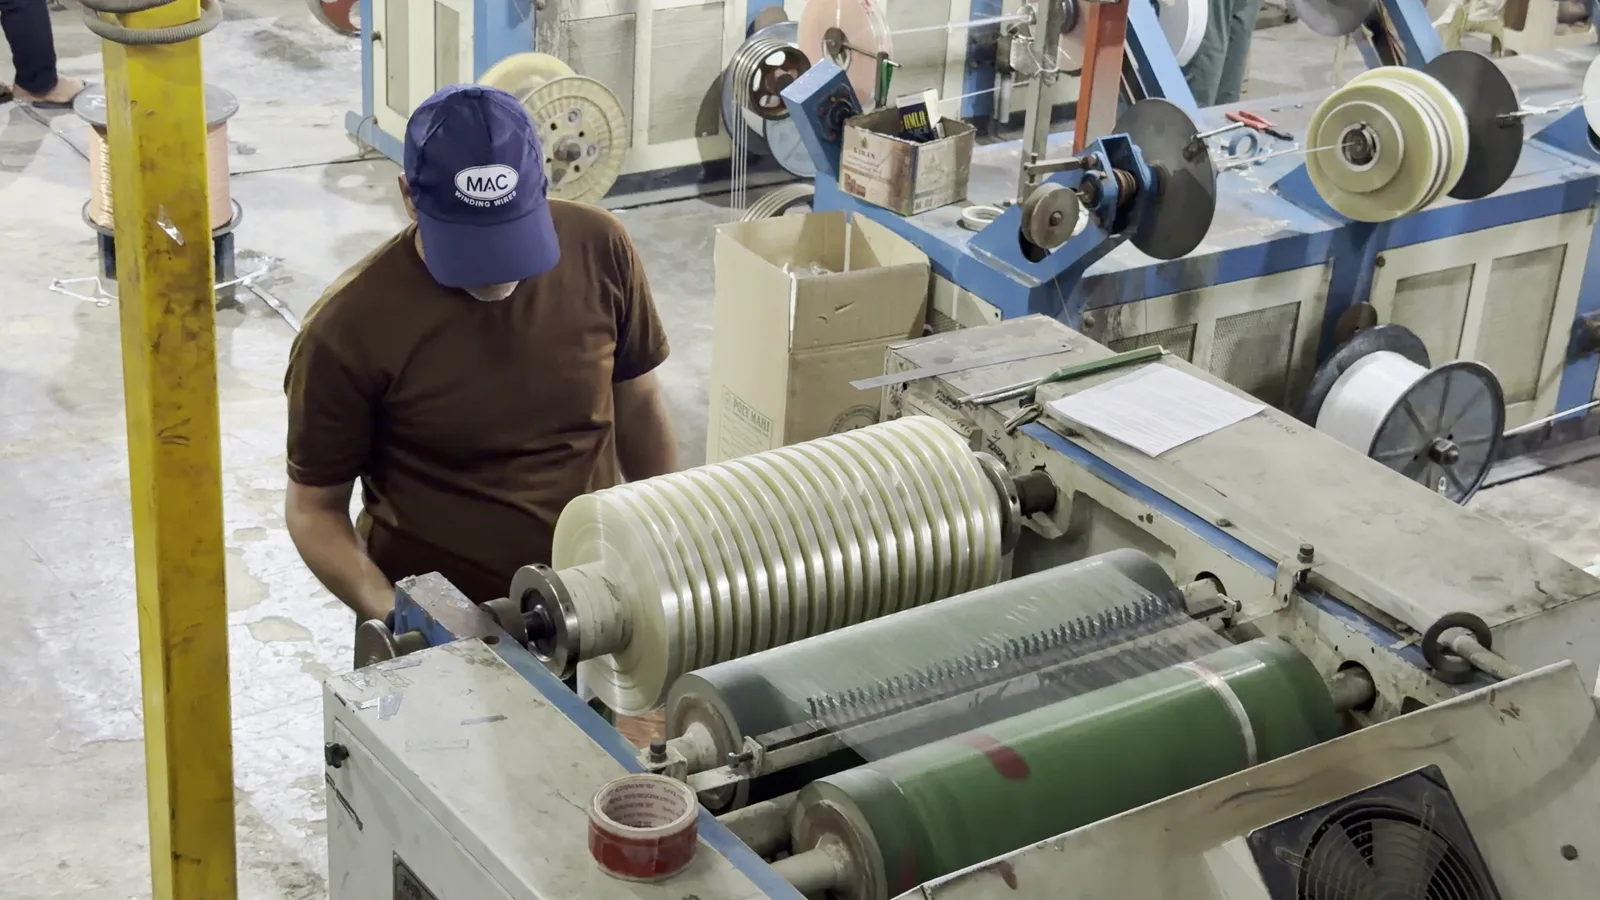
The installation in photos.
Solar that works around your business.
For businesses where electricity is a major operating cost, solar isn't just about generating power. It's about reducing the cost of running the business.