Why Commercial Solar is the Best Investment in 2026
Commercial solar in 2026 offers 18–22% IRR, 2–3 year payback, and 60–80% lifetime electricity savings — supported by rising grid tariffs, softening module costs, and accelerated depreciation. A factual, data-driven case for CFOs and plant heads.
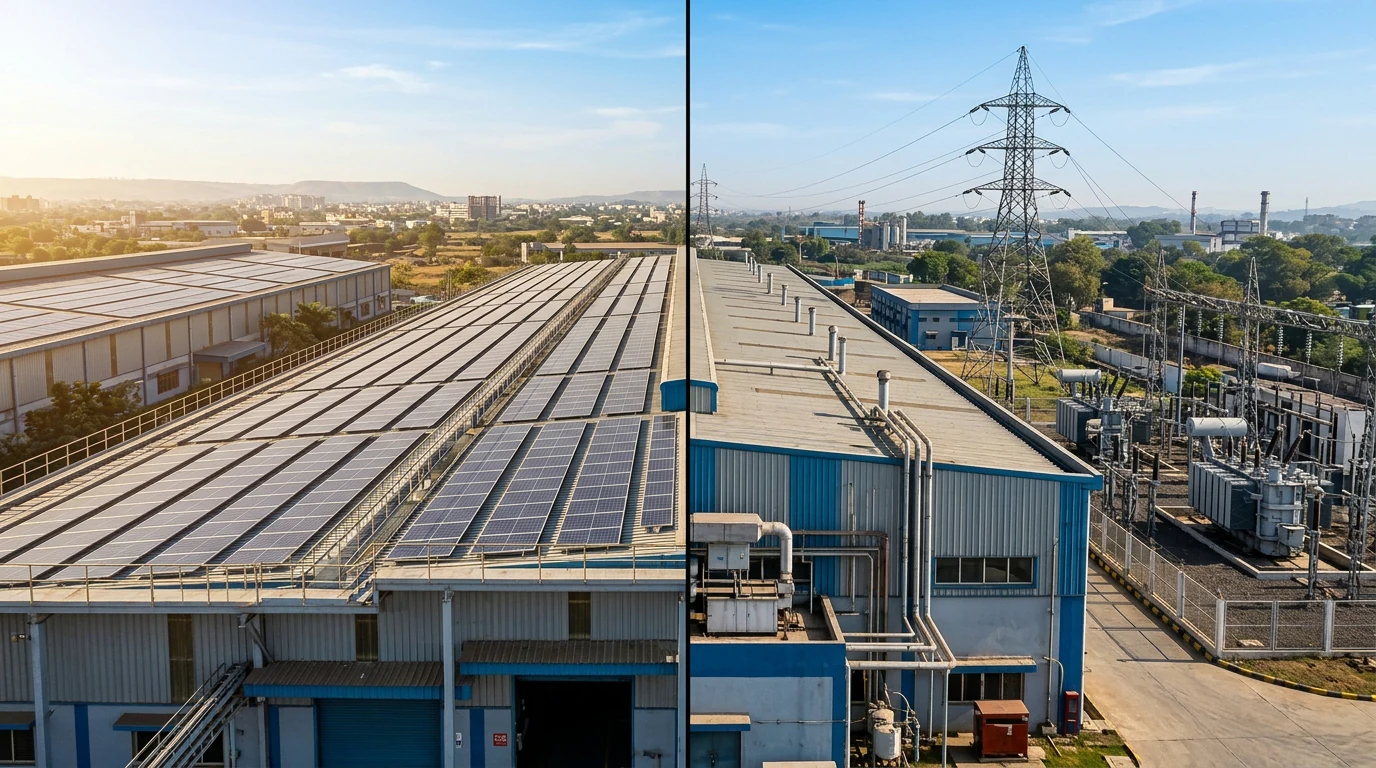
For most commercial and industrial businesses in India, electricity is no longer a predictable line item. Grid tariffs for C&I consumers have been increasing at 4–6% annually across states, and in several high-voltage industrial categories — particularly in states like Chhattisgarh, Tamil Nadu, and Maharashtra — effective tariffs including surcharges now sit in the ₹9–11.50 per unit range.
Against this backdrop, commercial solar investment India 2026 presents a fundamentally different financial case than it did even three years ago. The combination of stable-to-declining module costs, improved financing structures, strong tax incentives, and rising grid tariffs has made solar energy for industries India 2026 one of the clearest infrastructure investment decisions available to businesses across sectors.
This blog presents the factual, data-driven case for why commercial solar is the best investment in 2026 — structured around the financial metrics that matter to CFOs, plant heads, and business owners.
The Numbers: What Commercial Solar Returns Look Like in 2026
The financial case for commercial solar in 2026 is grounded in four metrics: payback period, IRR, lifetime savings, and grid tariff protection. Here is where each of those metrics stands today.
Payback Period
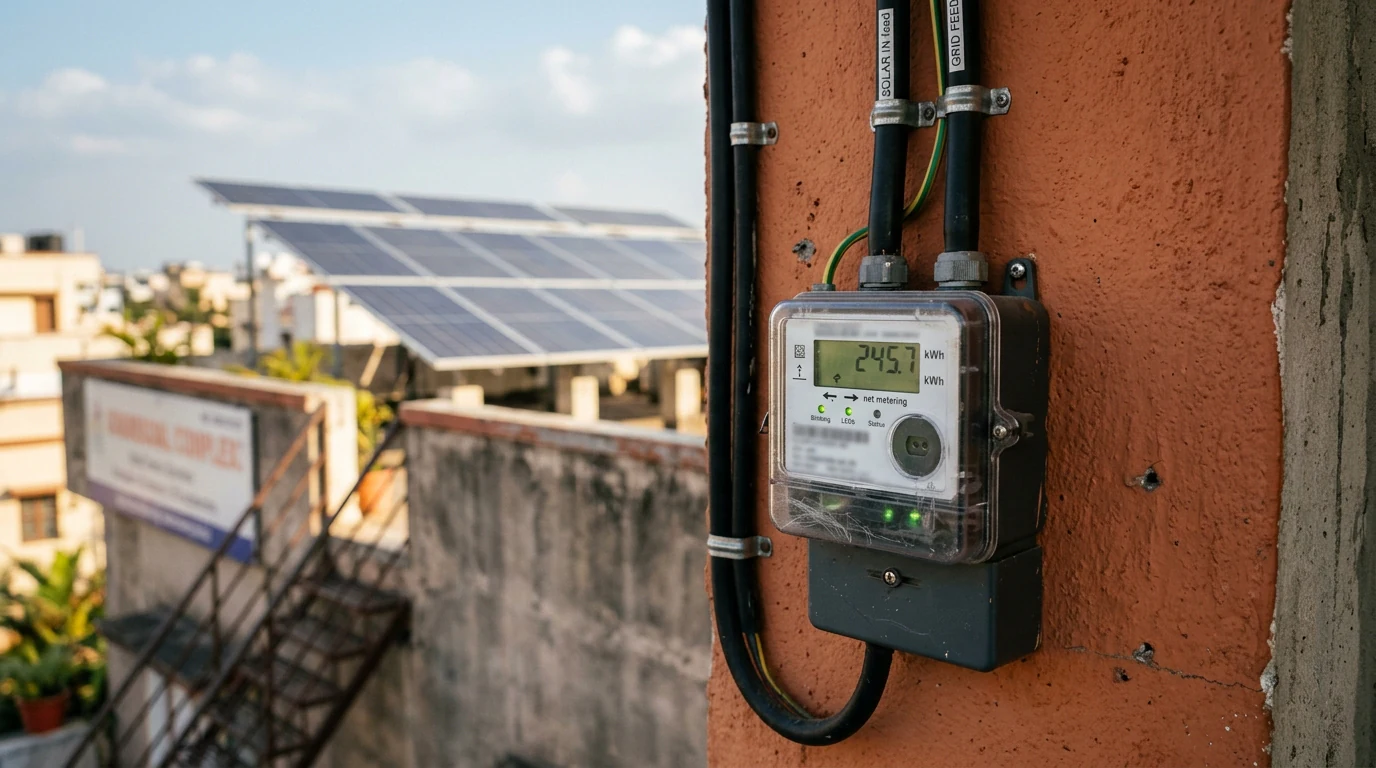
The commercial solar payback period India currently ranges between 18 to 24 months for rooftop CAPEX installations, and 2–3 years for ground-mounted industrial systems. For businesses using the OPEX — where a third party owns and operates the plant — the payback is effectively immediate, as savings begin from Day 1 without any capital outlay.
Post payback, the system continues to deliver low-cost power for 20+ additional years. This is the structural advantage of solar as an asset: unlike a piece of equipment that depreciates without generating revenue, a solar plant generates measurable financial returns every year of its operating life.
Internal Rate of Return (IRR)
For C&I projects, solar IRR for C&I projects India in 2026 sits in the range of 18–22%, depending on system scale, state tariff, and financing structure. To contextualise this: a fixed deposit in India currently yields 6.5–7.5%. Corporate bonds yield 8–10%. Solar, as an infrastructure investment with a 25-year asset life, is delivering IRR that materially outperforms most conventional financial instruments available to businesses.
The reason the solar IRR holds up strongly is that its primary return driver — electricity savings — compounds over time as grid tariffs continue to rise. A system installed today locks in your cost of generation at ₹2.5–3.5 per unit over 25 years. The grid tariff your business avoids is currently at ₹8–11.50 per unit, and rising.
Lifetime Savings
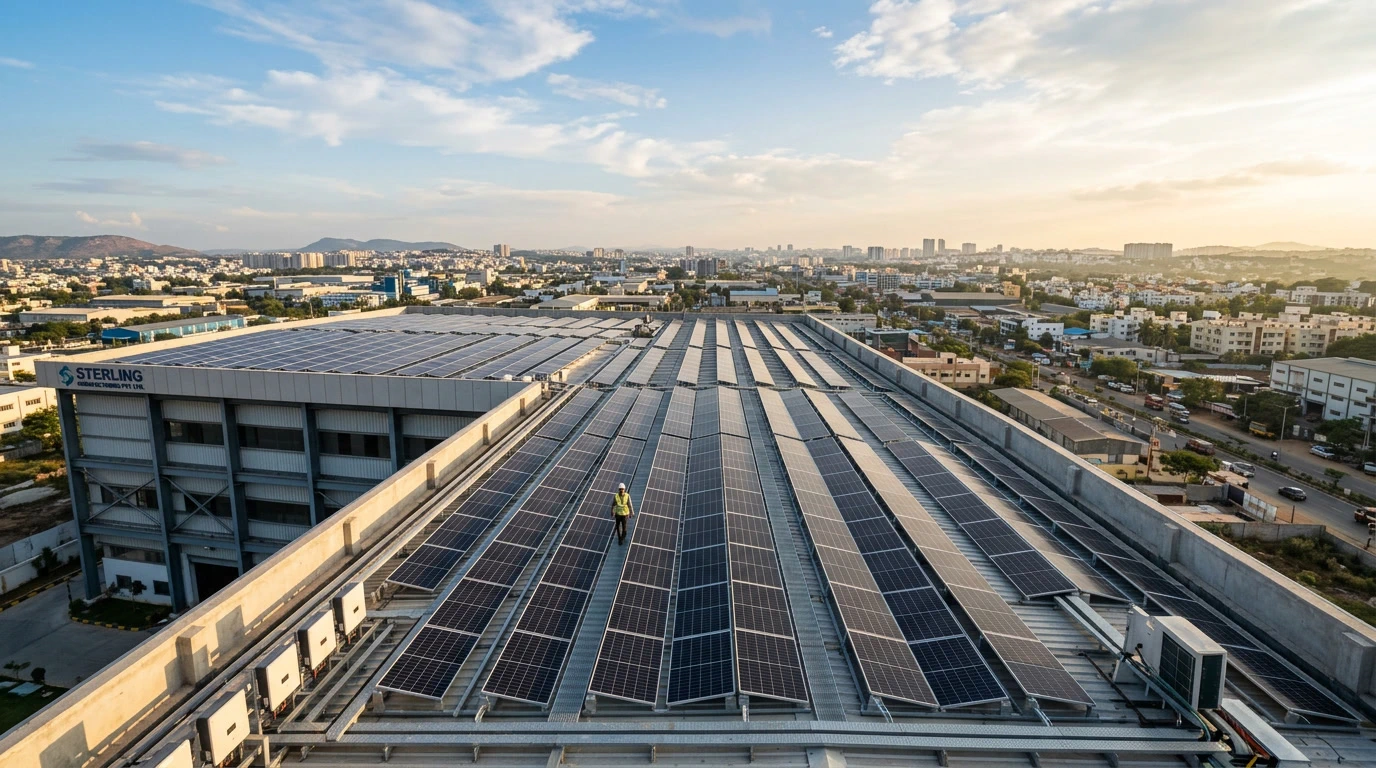
Over a 20–25-year operating life, commercial rooftop solar returns India businesses can expect translate to savings of 60–80% on electricity costs across the system's lifetime. For a 500-kW rooftop installation — a scale relevant to mid-size factories, warehouses, and commercial buildings — annual savings can reach ₹75 lakh to ₹1 crore depending on state tariff and consumption alignment. Over 25 years, the lifetime savings figure becomes a material contribution to business profitability.
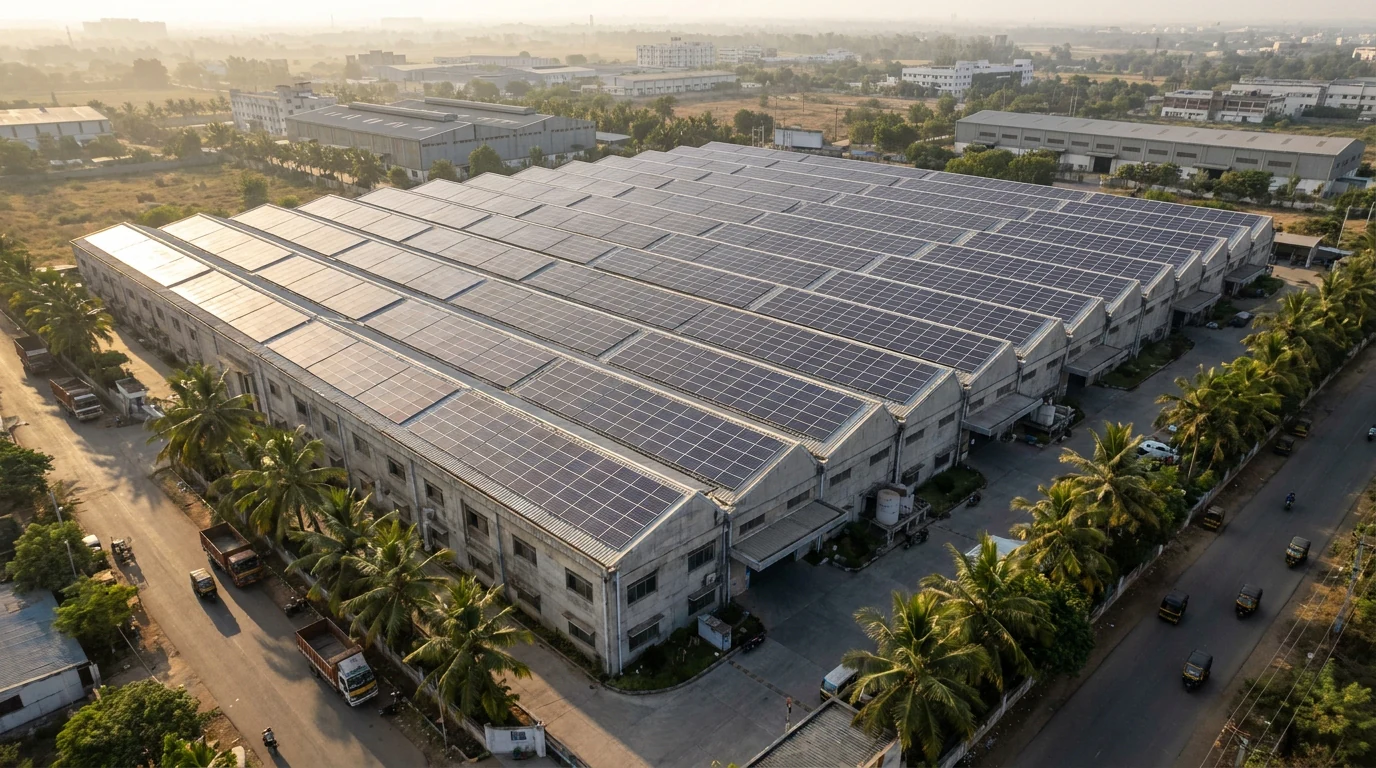
Aerial view of an Indian factory rooftop fully covered with solar panels — the kind of installation delivering 18–22% IRR in 2026.
Which Solar Model Fits Your Business?
Capex, Opex PPA, or Open Access — get a site-specific recommendation with system size, savings, and payback in 24 hours.
Why 2026 Is Particularly Well-Timed for Commercial Solar Investment
Beyond the base financial case, several specific factors make 2026 an especially well-timed entry point for commercial solar investment India.
1. Grid Tariffs Are Structurally Rising — and Accelerating
Rising electricity tariff impact on businesses India is no longer a future risk — it is the current reality. Tamil Nadu increased industrial tariffs by 3.4% in FY 2026, bringing industrial rates to ₹7.5 per unit. Commercial rates in the state reached ₹9.4 per unit. Similar revisions have been implemented across Karnataka, Maharashtra, and Rajasthan, with frameworks allowing annual hikes of up to 6%.
The implication is direct: every year a business delays its solar investment, the grid tariff it is paying increases, while the savings solar would have delivered are permanently lost. Solar vs grid electricity cost India 2026 is not a close comparison — it is a gap that widens every year.
2. Module Costs Have Stabilised — With Modest Softening
After the significant price run-up through 2023–24, global oversupply of solar modules has introduced 5–8% price softening in early 2026. Combined with the GST reduction on solar PV modules from 12% to 5% implemented in 2025, the current procurement environment is more favourable than it has been for the past two years.
For commercial buyers in India, this represents a window where module costs are declining modestly while grid tariffs continue to rise — a combination that compresses the solar payback period and improves IRR for projects commissioned in 2026.
3. Accelerated Depreciation Provides a Significant Tax Advantage
One of the most underutilised financial benefits of commercial solar investment India is the accelerated depreciation provision under the Income Tax Act. Businesses can claim 40% depreciation on their solar plant in Year 1 of commissioning. For a profitable company paying 25–30% corporate tax, this materially reduces the effective project cost and significantly improves post-tax IRR.
This benefit is available exclusively to businesses that own the asset under a CAPEX model — making the ownership question a financially important one, not just an operational preference. For many C&I businesses with taxable profits, the post-tax payback period on a CAPEX solar investment is closer to 2.5–3.5 years when accelerated depreciation is fully accounted for.
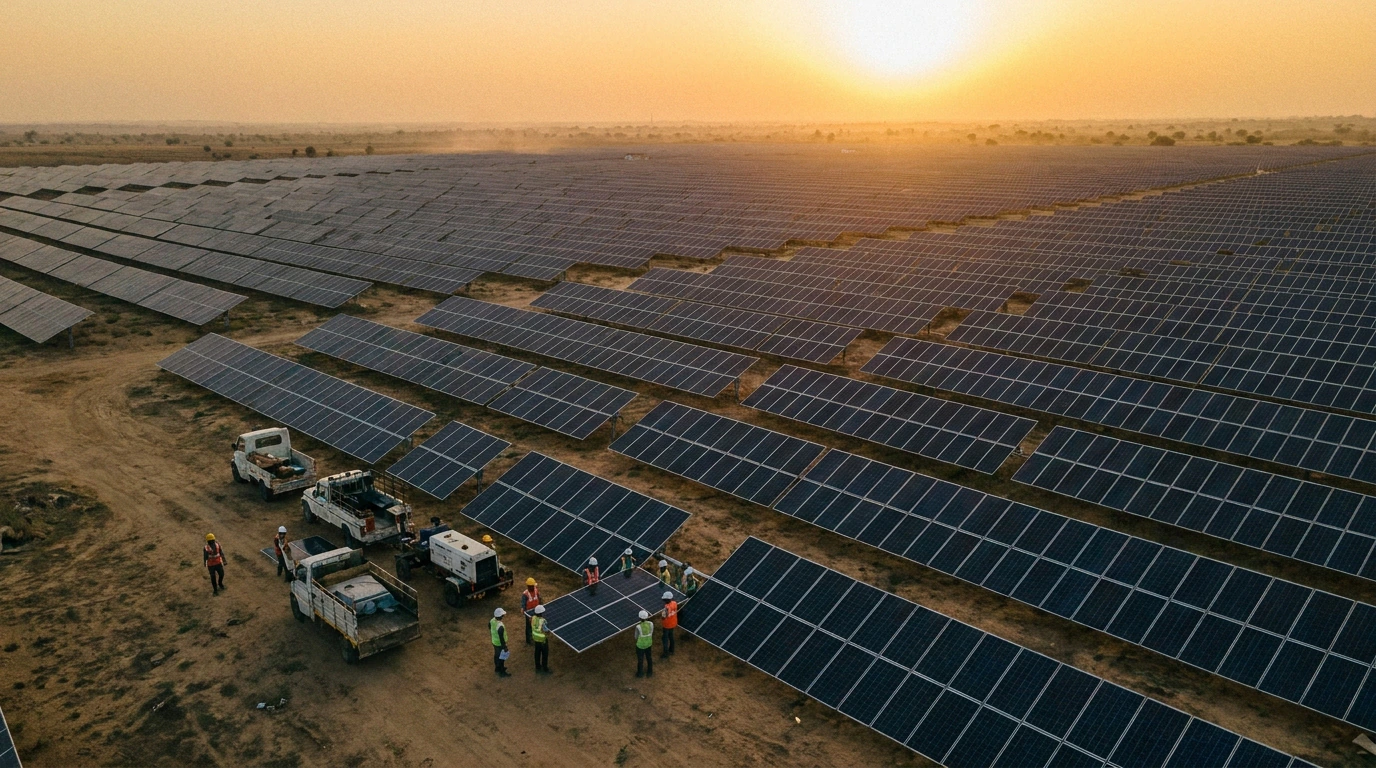
4. C&I Open Access Has Grown to Over 30 GW — and Growing
As of 2025, renewable energy procurement by C&I consumers in India has crossed 30 GW, growing at a CAGR of 22% between 2020 and 2024. This is not a niche or experimental category — it is a mainstream business decision being made at scale across manufacturing, retail, logistics, healthcare, and commercial real estate sectors.
Captive and third-party open access transactions have delivered 20–30% savings compared to grid tariffs in most states, with Maharashtra's Group Captive Open Access model achieving savings of nearly 55% in some configurations. The infrastructure, regulatory framework, and market depth now exist for C&I solar to be executed reliably and at scale.
Solar as a Long-Term Infrastructure Asset — Not Just a Cost-Saving Tool
The framing of solar purely as an electricity cost reduction measure understates what it actually represents on a balance sheet. Long term solar plant value India businesses build over a 25-year asset life includes several dimensions beyond the energy savings line.
A well-maintained solar plant is a depreciable infrastructure asset that generates measurable, auditable energy output year after year. It reduces exposure to grid tariff volatility — which, as documented above, is a structurally rising cost. It supports ESG reporting requirements that are now mandatory for listed entities under India's BRSR framework and increasingly relevant for exporters facing the EU's Carbon Border Adjustment Mechanism (CBAM), which entered into force in January 2026.
For businesses with EU export exposure, the ESG benefits of solar for businesses India extend directly to trade competitiveness. Carbon-intensive manufacturing processes will face CBAM charges on exports to the EU. Solar generation that can be documented and audited at the meter level reduces the carbon intensity of production and provides a defensible position in both regulatory compliance and green procurement conversations with international buyers.
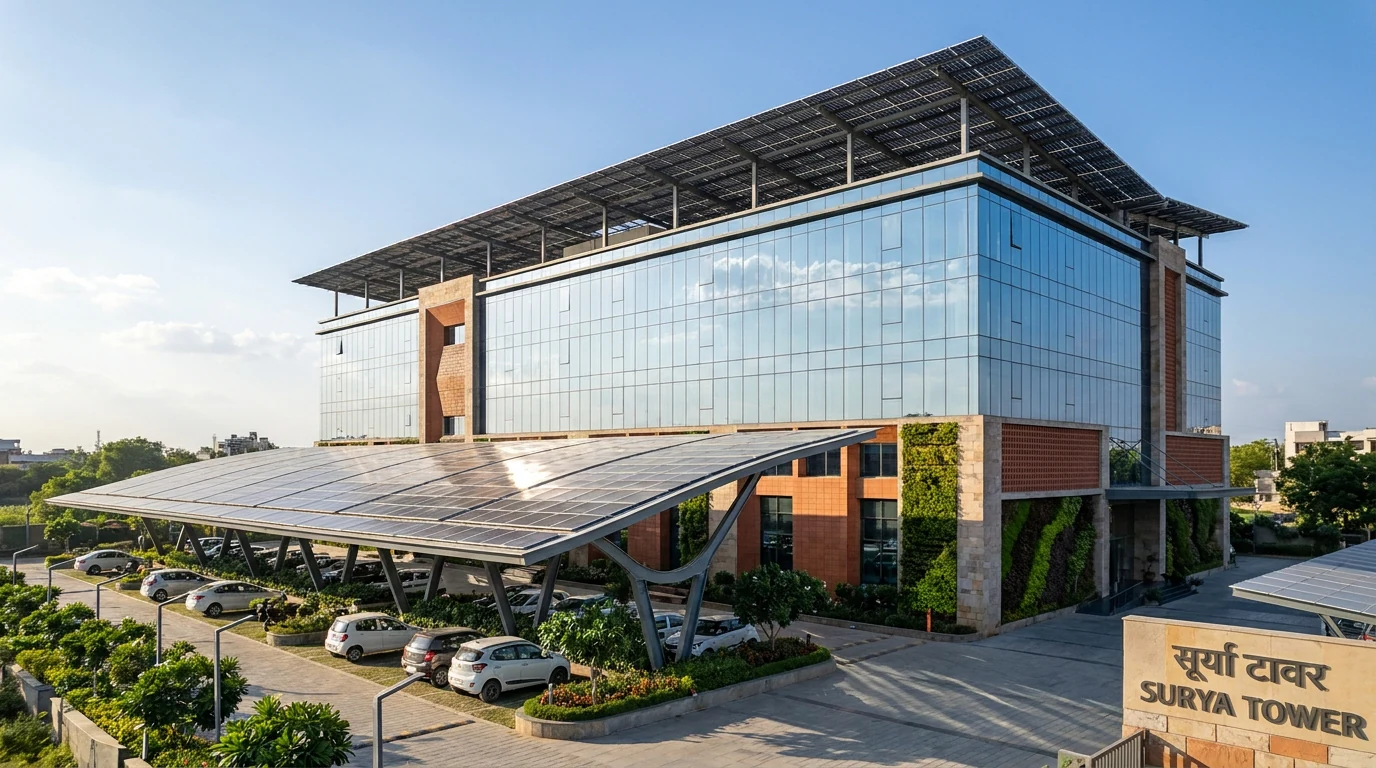
A modern Indian commercial building with rooftop solar and an integrated parking canopy — solar treated as long-term infrastructure rather than a one-off cost-saving measure.
Choosing the Right Investment Model: CAPEX, OPEX, or PPA
The solar ROI for businesses India 2026 varies meaningfully depending on which ownership and financing model a business selects. Each model has a distinct financial profile.
CAPEX (Asset Ownership)
The business owns the solar plant outright. Full electricity savings accrue to the business from Day 1. Accelerated depreciation is available. IRR is typically highest under this model — 18–22% for well-structured projects. Best suited for businesses with available capital or access to solar-specific financing, and with taxable profits that can utilise the depreciation benefit.
OPEX Model
A third-party developer owns and operates the plant. The business buys power from the plant at a contracted rate — typically 20–30% below the prevailing grid tariff. No upfront capital required. Savings begin immediately. Best suited for businesses with constrained capital budgets or those who prefer not to manage a generation asset.
Solar PPA (Power Purchase Agreement)
A solar PPA for commercial consumers India is a long-term contract to purchase solar-generated power at a fixed rate, typically 15–25 years. The fixed rate provides certainty against grid tariff escalation. For businesses that need long-term energy cost predictability for financial planning — particularly in manufacturing where energy is a significant input cost — a PPA structure offers strong strategic value even if it does not deliver the highest absolute IRR.
The ESG and Corporate Sustainability Dimension
Corporate renewable energy strategy India 2026 is no longer optional for listed entities and large exporters. India's BRSR (Business Responsibility and Sustainability Reporting) framework now requires the top 1,000 listed companies to disclose detailed ESG metrics, including energy consumption, emissions intensity, and renewable energy share. Solar generation that is metered and documented contributes directly to these disclosures.
India has also launched its Carbon Credit Trading Scheme (CCTS), expected to be operationally active through 2026, adding a monetisable dimension to renewable energy adoption for eligible businesses. Green energy for commercial buildings India — whether rooftop solar on warehouses, factories, or office campuses — directly contributes to carbon credit eligibility and ESG rating improvements.
For businesses supplying to European markets, the CBAM, which entered into force in January 2026, makes the carbon intensity of production a commercial factor, not just a compliance one. Solar adoption that reduces grid electricity consumption is a direct lever for lowering embedded carbon in manufactured goods — and for protecting access to EU markets on competitive terms.
Who Should Be Investing in Commercial Solar in 2026?
The financial case for best solar investment India 2026 is strongest for businesses with the following characteristics:
- High daytime electricity consumption — manufacturing, processing, warehousing, retail, and healthcare all fit this profile
- Grid tariff in the ₹8–11.50 per unit range — the higher the tariff, the stronger the solar case
- Available rooftop or ground area aligned with consumption load — typically 8–10 sq metres per kW of installed capacity
- Taxable profits — to fully utilise the 40% accelerated depreciation benefit under CAPEX ownership
- ESG reporting obligations or export market exposure — where documented renewable energy consumption adds direct commercial value
- Long-term facility tenure — a 25-year asset requires a stable underlying use case to deliver its full return
Why Investment Returns Depend on Execution Quality
The financial returns described in this blog — 18–22% IRR, 3–5 year payback, 60–80% lifetime savings — are achievable for well-designed and well-executed commercial solar projects. They are not guaranteed by the decision to invest in solar alone.
The gap between a project that delivers its projected returns and one that underperforms is almost always traceable to engineering design quality, module and inverter selection, installation workmanship, and post-commissioning O&M. A system that is undersized, poorly oriented, or fitted with low-quality components will deliver lower generation output — which directly reduces savings, extends payback, and compresses IRR.
For why invest in solar India 2026 to translate into the returns the numbers promise, the EPC partner, the equipment specifications, and the monitoring and maintenance framework matter as much as the decision to invest.
Summary
Commercial solar investment India 2026 offers a financial profile that very few business infrastructure investments can match: an IRR of 18–22%, a payback period of 2–3 years, lifetime electricity savings of 60–80%, and a 25-year asset with minimal maintenance requirements.
This return profile is supported by rising grid tariffs, favourable module procurement conditions, strong tax incentives, and a growing regulatory and commercial imperative to demonstrate renewable energy adoption.
Solar vs grid electricity cost India 2026 is not a marginal difference — it is a gap of ₹6–9 per unit that widens every year grid tariffs increase. For any C&I business with meaningful daytime electricity consumption, the question in 2026 is no longer whether solar makes financial sense. It is how to structure, size, and execute the investment to extract the maximum return from it.