
Why Is My Solar Plant Underperforming?
Solar plant generating less than expected? Here's how PR ratio, soiling, and degradation affect output, and how to tell which one is causing the drop.
A solar plant generating less than expected is one of the most common, and most confusing, complaints for commercial and industrial owners. The confusion isn't whether something's wrong, it's figuring out what, since several very different problems can look identical on a monthly generation report.
Three factors explain most underperformance cases: Performance Ratio decline, soiling, and degradation. Here's how to tell them apart.
What Is Performance Ratio (PR)?
Performance Ratio is the industry-standard metric comparing a plant's actual energy output to its theoretical output under ideal conditions. A PR of 80% means the plant converted 80% of available solar resource into usable electricity, the remaining 20% was lost to heat, soiling, inverter inefficiency, cabling, and other factors.
Indian rooftop plants typically achieve a PR of 78-85% in year one, and a 1% drop in PR translates directly into a 1% drop in revenue, making PR the single most useful number for spotting a problem early.
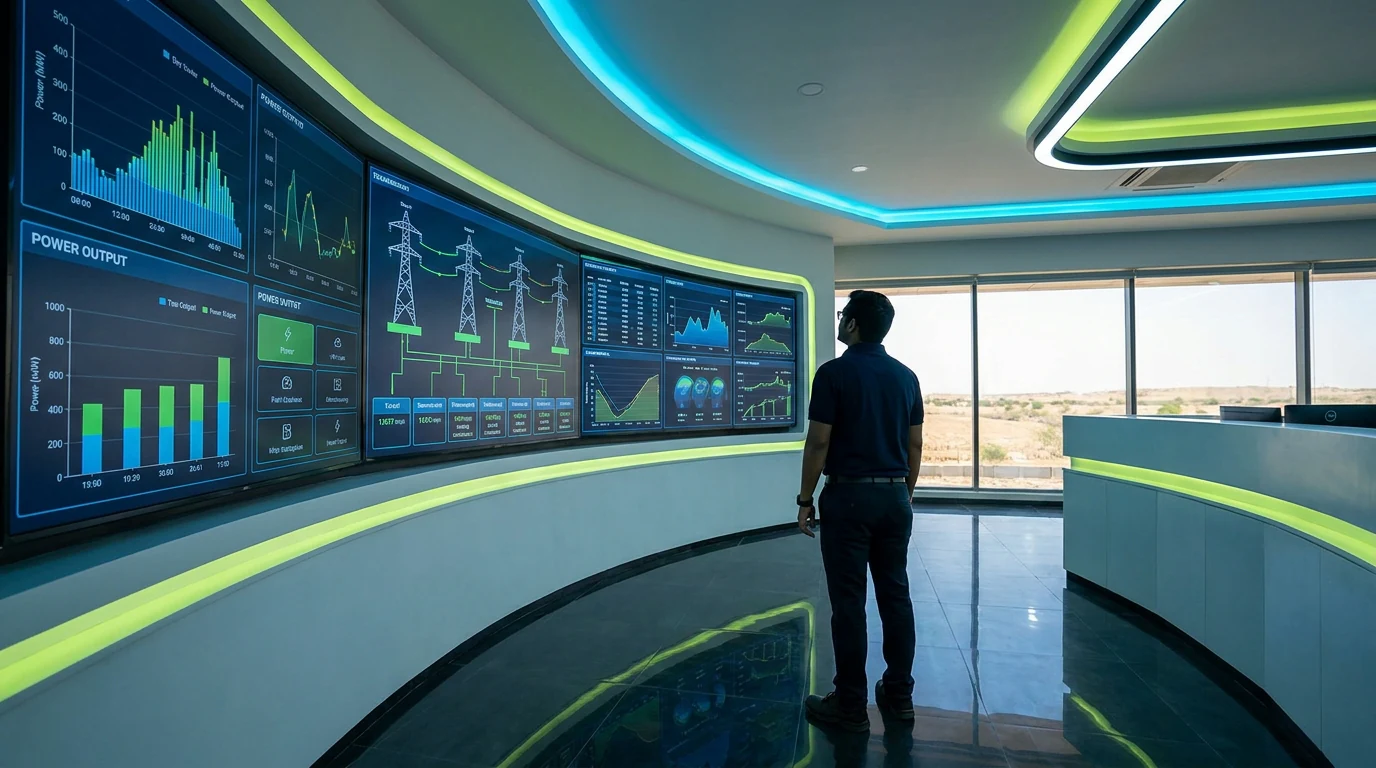
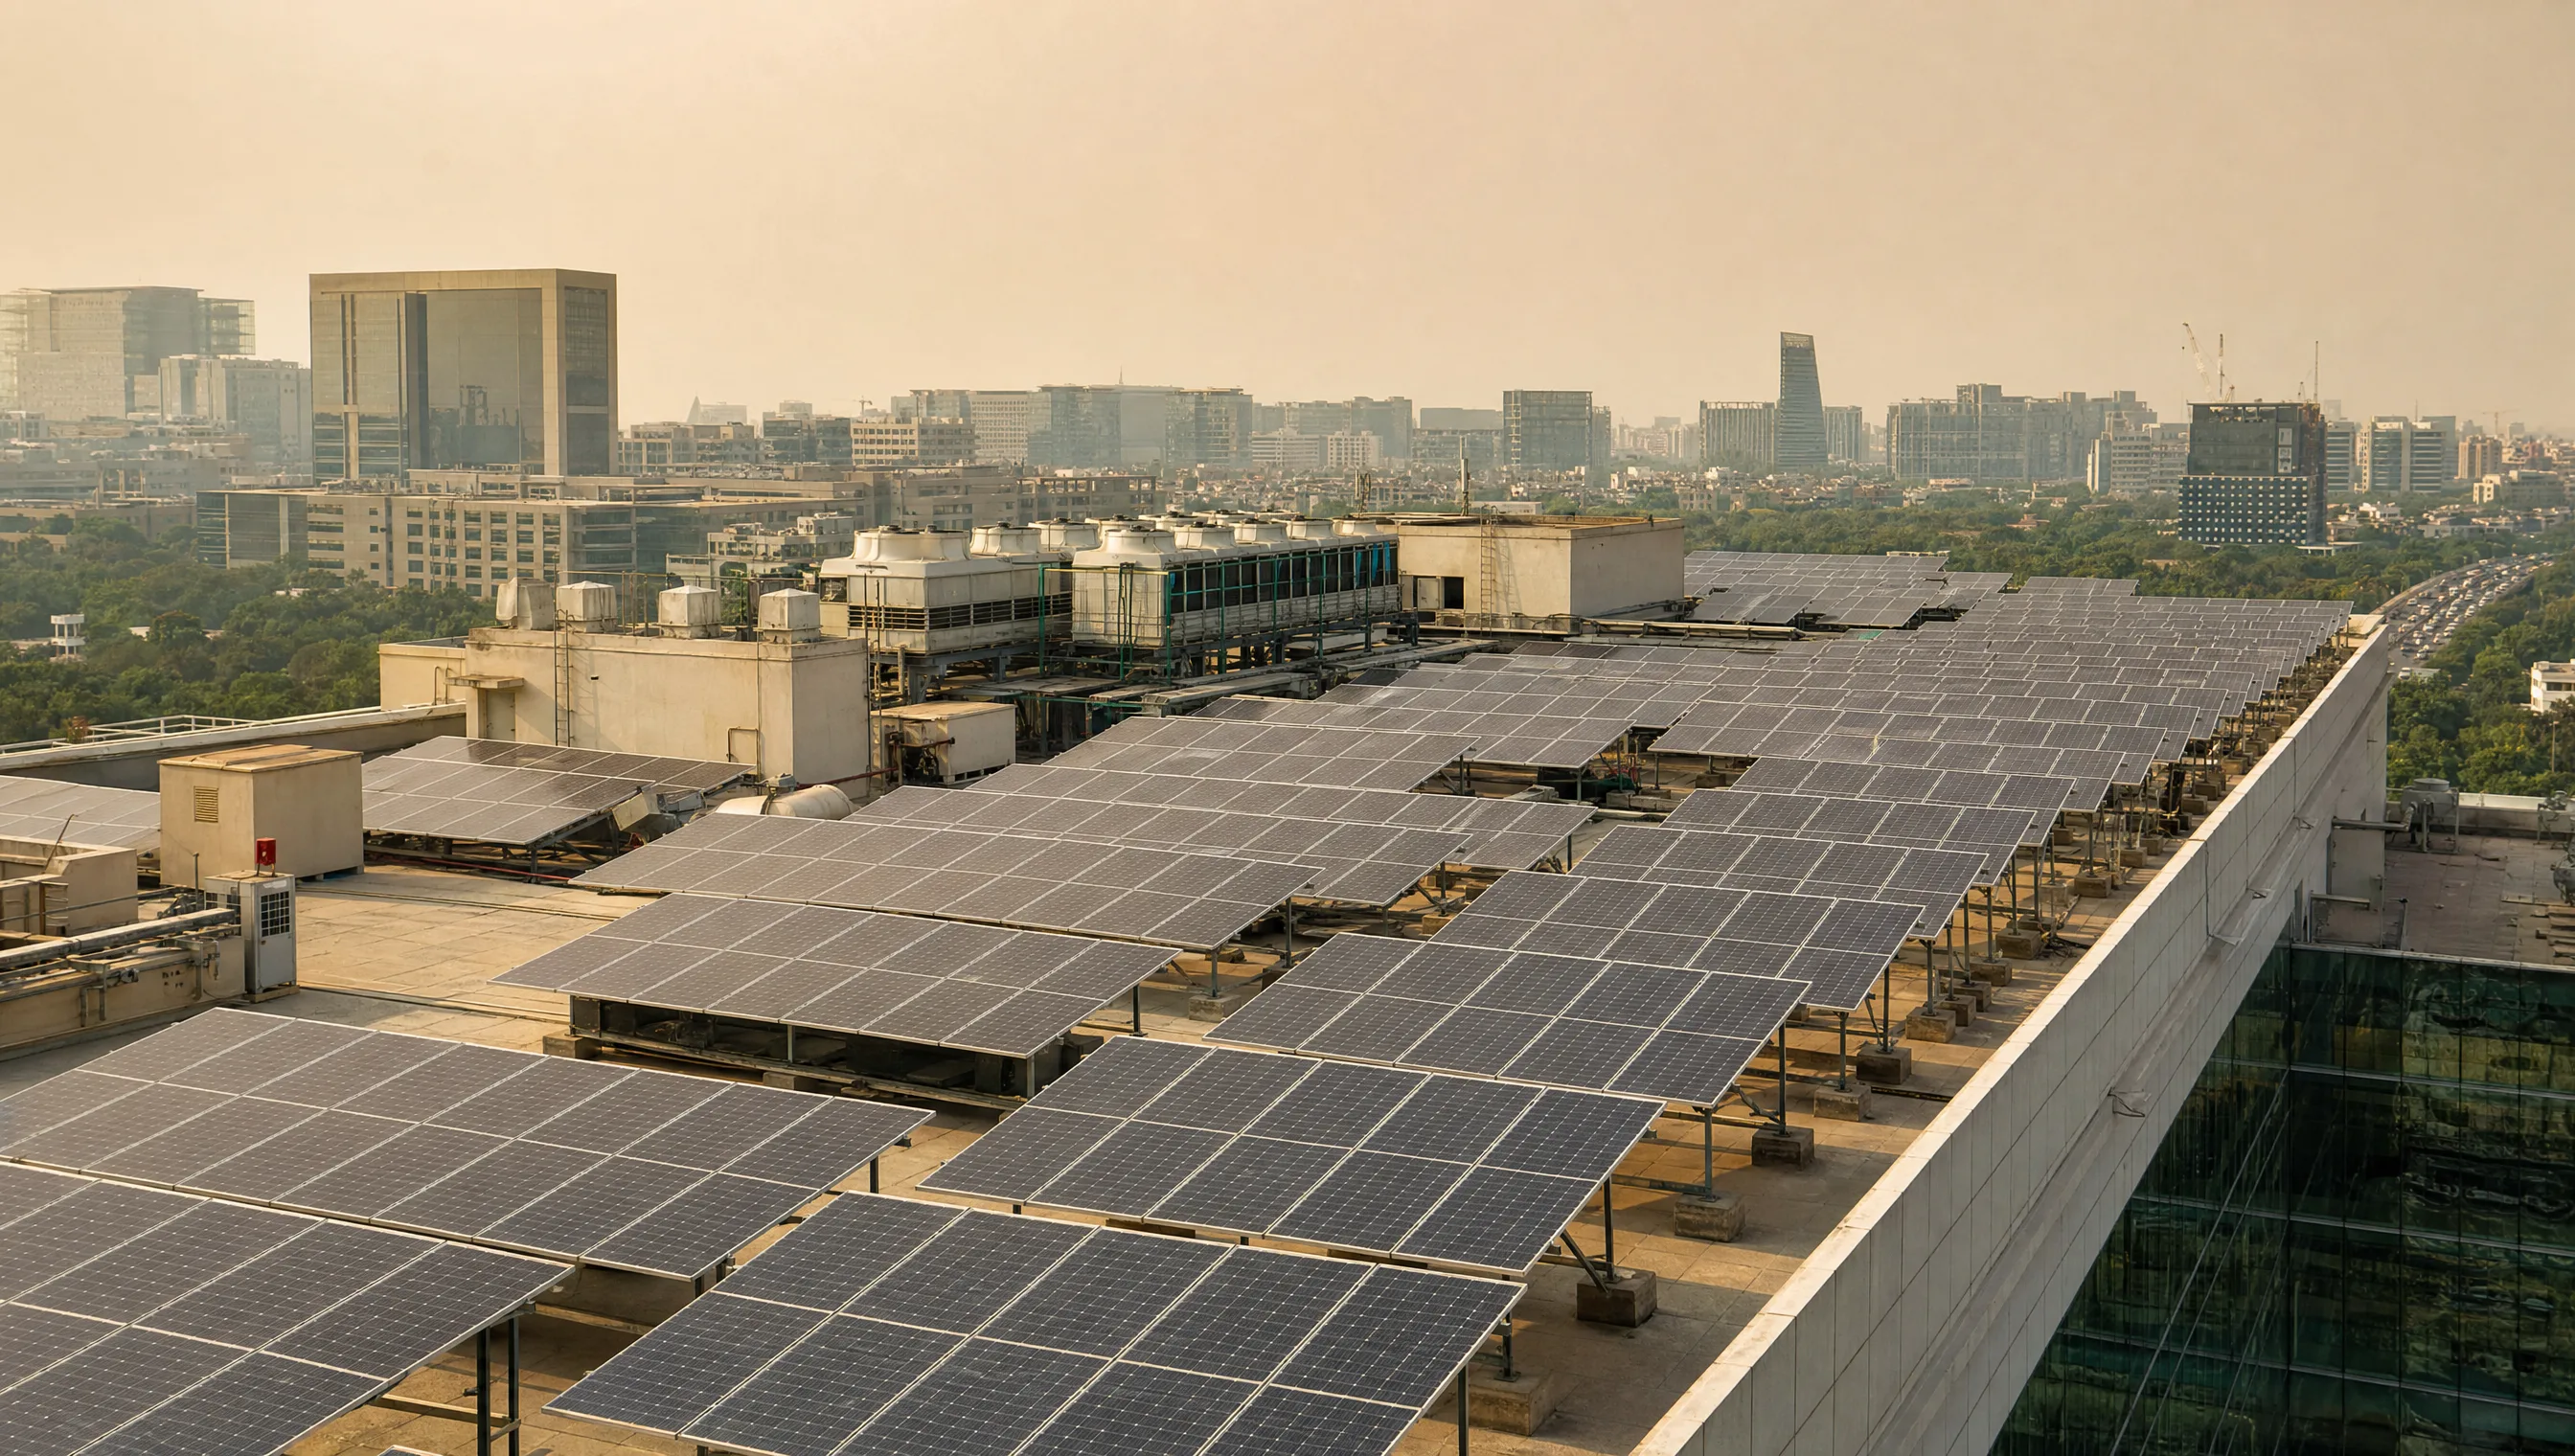
Performance monitoring dashboard tracking PR against expected output across a commercial solar portfolio.
Which Solar Model Fits Your Business?
Capex, Opex PPA, or Open Access — get a site-specific recommendation with system size, savings, and payback in 24 hours.
Cause 1: Soiling
Soiling, the accumulation of dust, pollution, and bird droppings on panels, is the most common and most fixable cause of underperformance in India. It can reduce output by up to 25% in dry, high-dust regions if left unmanaged, and unlike degradation, it's fully reversible with cleaning.
How to identify it: Soiling losses build up gradually between cleanings and then drop sharply right after a cleaning cycle. If PR recovers to baseline after cleaning, soiling was the cause. If it doesn't, the problem lies elsewhere.
Cause 2: Degradation
Degradation is the slow, permanent decline in a panel's power output over time, typically 0.4-0.7% per year for modern modules, caused by UV exposure, thermal cycling, and normal aging.
How to identify it: Degradation is gradual and irreversible, no amount of cleaning brings the output back. A useful benchmark: if PR is declining consistently by more than 1% per year, well above the expected degradation rate, something else (soiling, a fault, or shading) is likely also at play, not degradation alone.
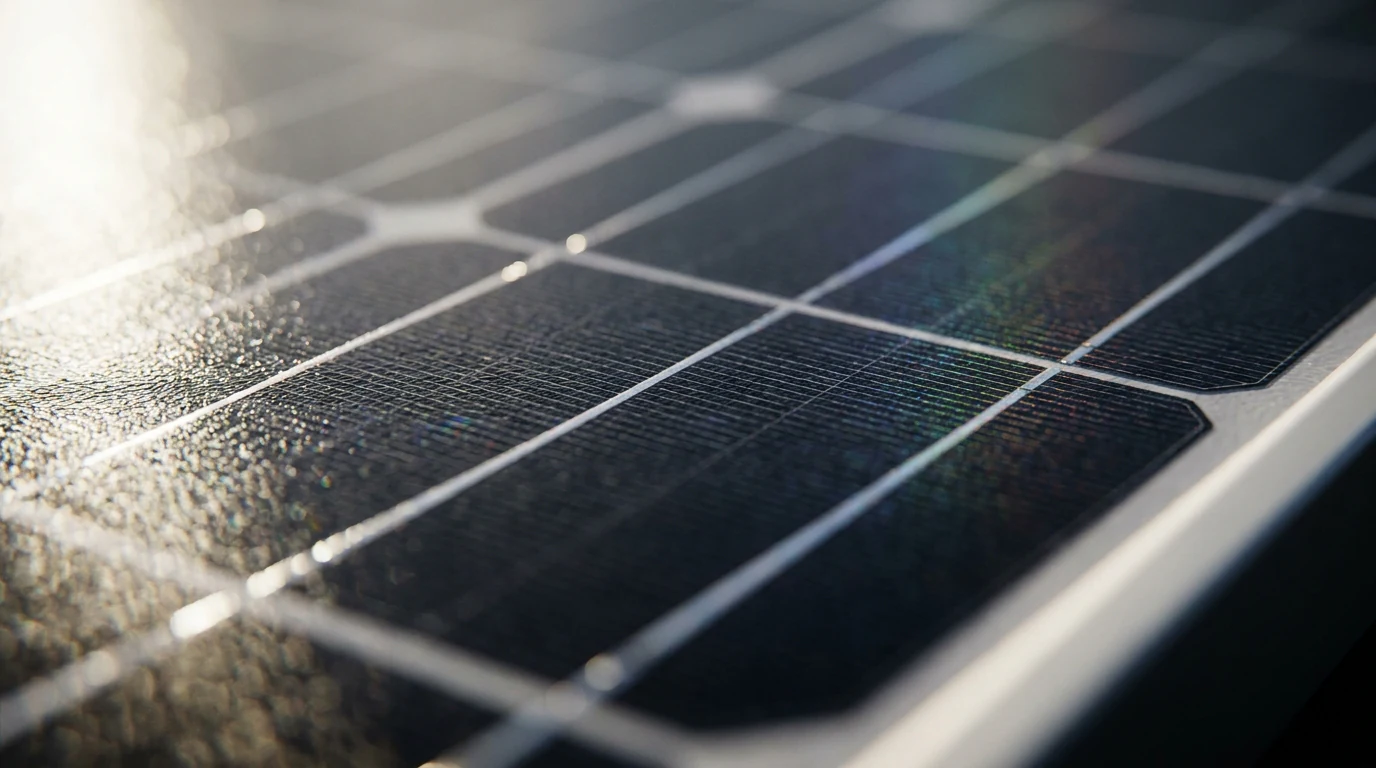
Close-up of an aged solar panel surface showing normal degradation patterns from years of UV exposure and thermal cycling.
Cause 3: Faults, Shading, And Wiring Issues
Beyond soiling and degradation, a real drop in PR can come from inverter faults, new shading (a tree that's grown, a structure built nearby since commissioning), or deteriorating DC wiring and connectors that increase resistive losses.
How to identify it: If PR drops sharply and stays down, unrelated to a dry spell or dirt buildup, and doesn't recover after cleaning, it points to a fault rather than soiling or normal degradation. This is usually where a proper site inspection becomes necessary.
How To Tell Which One Is Actually Happening
Track PR over time, not just total generation. A raw kWh number can look "low" simply because of a cloudy month; PR strips that variable out and isolates genuine system issues.
Check PR before and after cleaning. If PR recovers fully post-cleaning, soiling was the cause. If it doesn't recover, look elsewhere.
Compare the decline rate to expected degradation. A drop faster than roughly 0.5-0.7% per year isn't normal aging, it signals a fixable problem worth investigating.
Use string-level monitoring where available. If only one section of the plant underperforms while others stay steady, the cause is usually localized (a shaded panel, a failed connector), not a plant-wide issue like soiling or inverter inefficiency.
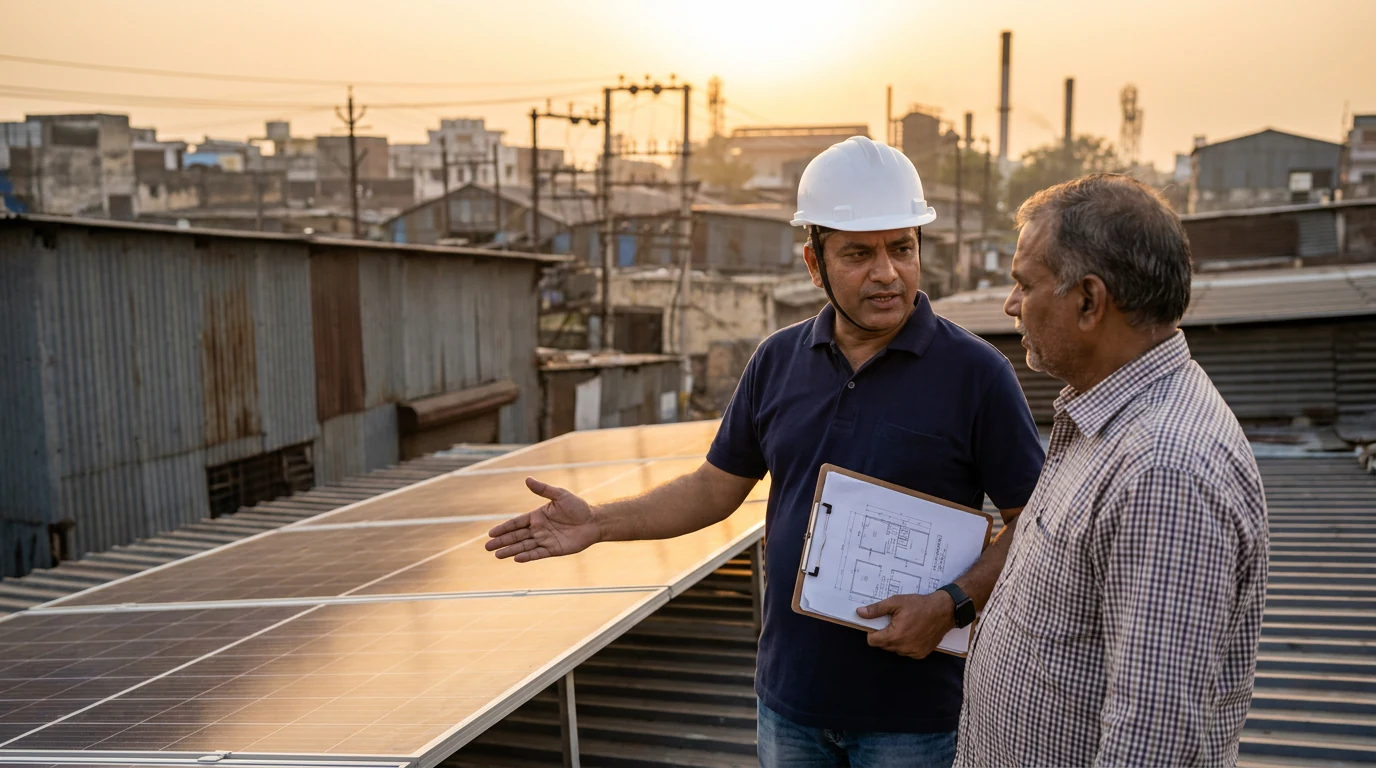
Business owner reviewing solar plant financial impact of underperformance losses against expected savings.
What This Means Financially
Since PR translates almost directly into revenue, even a modest, unaddressed decline compounds meaningfully over a 25-year plant life. A plant losing 5% to unmanaged soiling in a dusty region, for instance, is losing 5% of its expected savings every single month until it's cleaned, a loss that's completely avoidable with a proper maintenance schedule.
Questions buyers ask us.
Indian rooftop plants typically achieve 78-85% PR in year one. Anything meaningfully below this range, without an obvious cause like heavy shading, is worth investigating.
Yes, in high-dust regions with infrequent cleaning, soiling losses in India can reach up to 25% of potential output.
Degradation is gradual and doesn't recover after cleaning. If output rebounds fully after a clean, the cause was soiling, not degradation.
Modern panels typically degrade at 0.4-0.7% per year. A decline significantly faster than this points to another issue, not normal aging.
It significantly reduces it. Regular cleaning keeps soiling losses low, and routine inspection catches faults or shading issues before they compound.
At PowerMore, performance monitoring isn't an afterthought, it's tracked against PR benchmarks from day one, so soiling, degradation, or faults get caught and addressed before they quietly erode a plant's returns over its 25-year life.
Speak to our team to diagnose underperformance in your solar plant.